How to View System Status Information
Introduction
There is a large amount of information about the status of the IRMS System available to view directly within lyticOS. This document is a guide on how to access that system status information.
Status Displays
The instrument status is visible in two separate areas
-
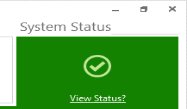
The “System Status Summary” box at the far right-hand end of the ribbon in the lyticOS Connected System window, provides a quick summary of the system. For more details information you can click the "View Status?" link, which will display the System Status panel.
Status Summary Panel
-
The System Status Panel, which can be displayed by clicking on the Layout Ribbon Tab > Common > System Status icon, or by clicking on the View Status link within the System Status Summary box
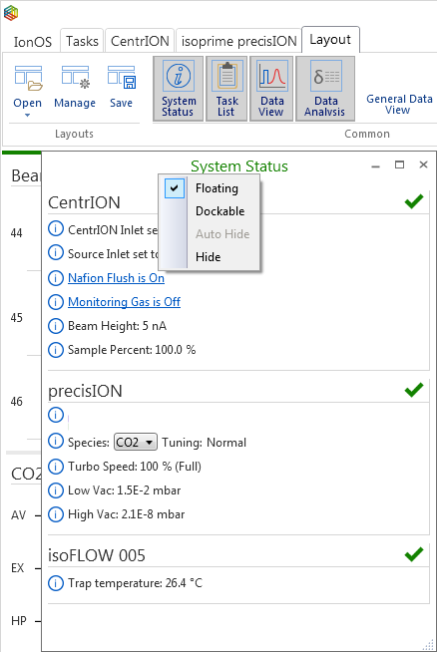
System Status Panel
-
System Summary Box
The System Status summary Box can appear in four color coded states, red, amber, green and green with bar:
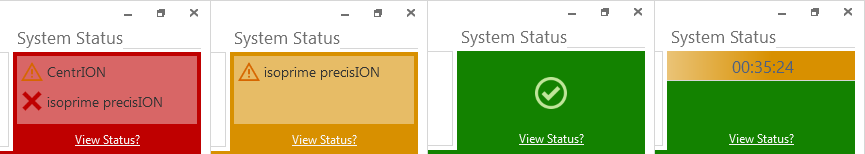
Different views of the Status Summary Pane depending on the status of the system
- Red (with associated red cross)
- Indicates some significant error that prevents the system from running
- In the above example there is a serious problem with the mass spectrometer.
- Note: An amber warning triangle may appear as well in the red box, indicating a less serious issue with another device within the system.
- Amber (with associated warning triangle)
- Indicates a relatively minor issue with the system that can be cleared by a simple action and doesn’t necessarily stop the system from running
- In the above example, there is a minor problem with the mass spectrometer.
- Green (with associated tick)
- Indicates that everything is working normally in the system and that it is “Good to Go”.
- Green (with the amber bar and included count down timer)
- Indicates that a task is running and the timer displays the approximate time remaining until task completion.
System Status Panel
The System Status Panel shows more detailed information about all the devices that are currently connected and the current state of the system.
The System Status Panel contains a collection of System Status Messages, grouped by devices.
The color and icon coding to indicate severity of System Status Messages continue from the System Summary Box through to the System Status Panel.
- A System Status Message with a red cross beside it indicates that the component is in a state that prevents operation
- A System Status Message with an amber warning triangle indicates a less serious error
- A System Status Message with an information icon beside it shows that the component is working correctly and indicates its status.
Example: How to identify errors and warnings
In the picture below, the System Summary Box shows a fault in the mass spectrometer and also a warning about the centrION. In this case, the system is automatically prevented from running.
The System Status Panel offers more details about the problems, showing that the error is that the source cover has been removed (which results in the source supplies being switched off for safety reasons and consequently a system unable to run) as well as a number of warning messages about the state of the mass spectrometer.
The System Status Panel is also showing the warning states for the centrION that lead to the amber warning triangle in the System Summary box, each of these identified with its own warning triangle.
Also shown in the system status panel are points of information.
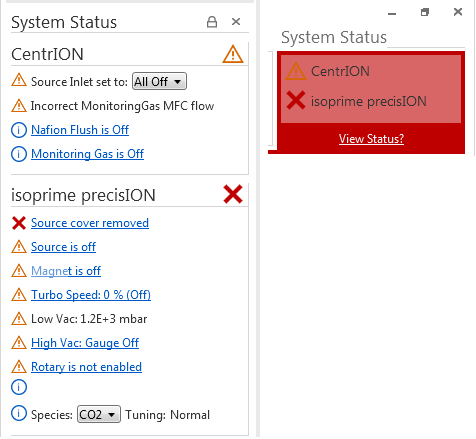
Example System Status Panel and System Status Summary pane when there are Error and Warning messages
View more or less information
You can right click within the System Status Panel to change the level of information that is displayed
- Normal
- This is the default setting and will display the information that is most relevant to most users
- Info
- Displays a bit more information than Normal mode
- Debug
- Displays a bit more information than Info mode
- Useful for diagnosis of problems.
The level of information displayed within the System Status Panel is synchronized with the Log Messages Panel (changing it in the System Status Panel will change it in the Log Messages Panel).
Interactive System Status Messages
Some of the System Status Messages are interactive. This is usually denoted by the System Status Message appearing as a "hyper-link" or having some editable component of the message (e.g. a drop-down menu).
Hovering the cursor over a hyper-link Interactive System Status Message displays more details about the message and describes what clicking the hyper-link will do.
Clicking on the hyper-link will perform the described operation.
If the fault condition hasn’t been rectified, the message will either remain or be replaced with some other messages.
Example
The "Source if off" warning message indicates that the source is switched off. Moving the mouse of the message shows the tooltip "Turn the source on", indicating that clicking the hyperlink will "Turn the source on", to correct the warning.

Source Is Off warning system status message
Failing To Connect
Sometimes, lyticOS will fail to connect to a particular device. In this case, lyticOS will display a single Error System Status Message indicating that the device "failed to connect". In this case, during connection, a dialog will be presented with more detailed information about why the device failed to connect. It is not possible to run any tasks within lyticOS while there are errors. To temporarily clear this particular error, you can click the Error System Status Message to change its severity to a warning.
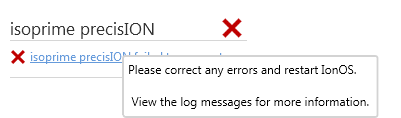
isoprime visION / precisION failed to connect error system status message with tooltip information
Need to think about visION vs precisION images here
Communication Error Messages
Sometimes, communication may be lost to a particular device. This may be due to the device losing power, or a more serious fault. This is typically displayed as an error message of the format "[Device / Sub Component] communication has stopped". This means that lyticOS has stopped trying to communicate with the Device or Component (after several failed attempts). If you rectify the problem (e.g. turn the power back on the device), then you can click the hyper-link of the Error Message and lyticOS will attempt to communicate with the device again.
Example Fault Conditions
Below are some examples of Error Status Messages (appearing as red crosses in the System Status Panel and show the System Summary Box as red), which result in the system automatically being prevented from running.
Devices Not Connected
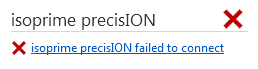
isoprime visION / precisIONfailed to connect system status message
The device did not connect. This is usually due to a communication problem. Verify that the device is switched on and physically connected to the PC. Verify that device communication settings are set correctly (e.g. correct COM port or IP address)
Interlocks Not Satisfied
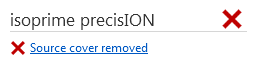
Source cover removed error system status message
If the source cover is removed, then the mass spectrometer will not run because the source power supplies have been automatically disabled for safety reasons.
Source Fault Conditions
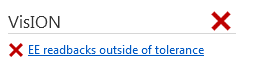
EE readbacks outside of tolerance error system status message
Sometimes lyticOS detects that there is a discrepancy between 1 or more tuning setpoint and its corresponding readbacks. If the discrepancy is serious enough, then the "outside of tolerance" error message is displayed. However, this message can also display as a warning, if the discrepancy is still within normal operating tolerances.
Example Warning Messages
Below are examples of warning messages. Warning messages won’t necessarily stop the task list from running, but indicate that the system may not be in its "Good to Go" state because something may need to be turned on, or the system is waiting for an action to complete (e.g. magnet cycle / species change) or other general warnings.
Source Issues
Example 1

Emission Limit and TC readbacks outside of tolerance warning system status messages
In this example there are two messages, which are actually symptoms of the same problem (likely due to poor filament alignment or filament distortion).
- Emission Limit
- The electron energy readback is more than 6V below the requested value and we are requesting more 5mA of emission current
- TC readbacks outside of tolerance
- The trap current readback is inconsistent with the trap current request.
- A trap current readback not corresponding to a request value (as a warning) doesn’t necessarily mean the instrument can’t function.
- The message is interactive, and clicking the message will attempt to resend the trap current setpoint to the mass spectrometer.
- The message will then be removed, but may reappear if the trap current readbacks remain inconsistent.
Example 2

Source is off and Magnet is off warning system status messages
In this case, both the Source and Magnet are turned off.
Clicking each message will turn the Source and Magnet on.
Example 3

Filament is off warning system status message
In this case, the filament is turned off (the source is therefore partially off - source high voltage may still be on).
Clicking the message will turn the filament on.
Other Mass Spectrometer Hardware:
Example 1

Turbo speed not at requested speed warning system status message
The Turbo is set to be fully on (as opposed to Stand By or Off) and is currently at 81% of full speed.
Example 2

The rotary is not currently turned on (or may be disconnected).
Clicking the message will turn the rotary on.
Example 3

The high vacuum gauge is currently turned off. The high vacuum gauge can only be turned on when the pressure reaches a certain threshold (if the pressure is too high, then it cannot be turned on).
Clicking the message will attempt to turn the high vacuum gauge on.
Example 4

An information message (not interactive), indicating that the low vacuum pressure is currently not at its optimum level.
Example 5

Magnet is off warning system status message
The magnet is off.
Clicking the message will turn the magnet on (and perform an automatic magnet cycle)
Example 6

Cycling magnet warning system status message
The magnet is currently cycling. Once the magnet has finished cycling, the message will automatically be removed.
This happens every time the current species of tuning is changed (and the desired magnet current is different from the previous value).
If manually changing the magnet current, then a "pending magnet cycle" interactive status message will be displayed, indicating that you must perform a manual magnet cycle (either by clicking the status message or clicking "Magnet Cycle" within the Ribbon).
centrION Messages
Example 1
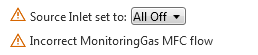
Source inlet set to all off and incorrect monitoring gas MFC flow warning system status messages
The source inlet valve is currently in its All Off position, meaning that there is no flow to the mass spectrometer.
Use the interactive drop-down to change the source inlet position. The message will change to indicate that it is changing position, which can take a few seconds.
Example 2

The "Waiting for Nafion to dry..." message appears after the Nafion has been turned on and counts down from 60 minutes.
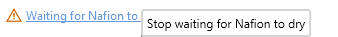
Waiting for Nafion to dry warning system status message with time remaining and tooltip informing that clicking the message will remove the message.
Clicking the message will remove the "Waiting for Nafion to dry..." message (as the mouse tooltip suggests)
Start Up Messages:
Example
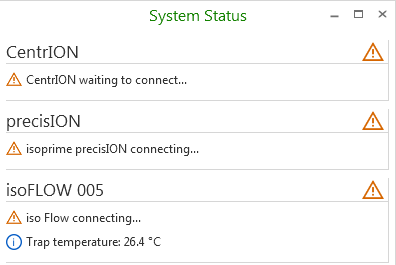
System Status Panel with example devices starting up
When the system is connecting, individual devices will display their connection status:
- [Device] connecting...
- The device is going through its connection and start up process
- As the device connects, status messages will start to be displayed
- [Device] waiting to connect...
- Some devices have dependencies on other devices
- Must wait for other devices to finish connecting before it can start is connection and start up process
Once the device has finished connecting, the "[Device] connecting..." message will be removed and the device status messages will then be displayed, or a message will be displayed to indicate that the device failed to connect (see the log messages panel for more information).
Example Information Messages
These are indicated in the System Status Panel by an information icon. If the only messages for any device are all of this type, then that particular device will have a “Good to Go” green tick in its header within the System Status Panel.
centrION
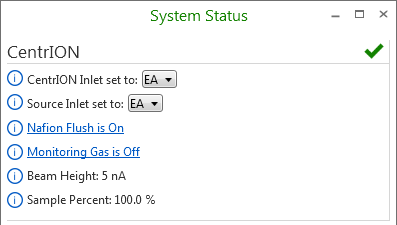
System Status Panel displaying interactive information messages for the centrION
isoprime visION / precisION
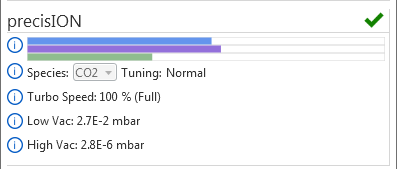
System Status Panel displaying interactive information messages for the isoprime visION / precisION
In the above examples that there are still some Interactive System Status Messages which can be
- clicked on to perform actions (e.g. turn the Nafion flush off and monitoring gas on)
- change drop-down selection (E.g. change the centrION inlet / source inlet positions and mass spectrometer species)
Debug Messages
Debug messages can optionally be displayed by changing the view mode of the System Status Panel. Debug messages appear with a "lightning" icon next to them. They are useful in helping diagnose problems.