Peak Maps
A Peak Map defines Compound names (peak labels) and their relative retention times (broadly speaking).
A Peak Map can be created by simply dragging compounds from the Peak Library onto the chromatogram, or by entering compound names and retention times directly into the Peak Maps editor.
Once a Peak Map has been defined it can be applied to one or more injections.
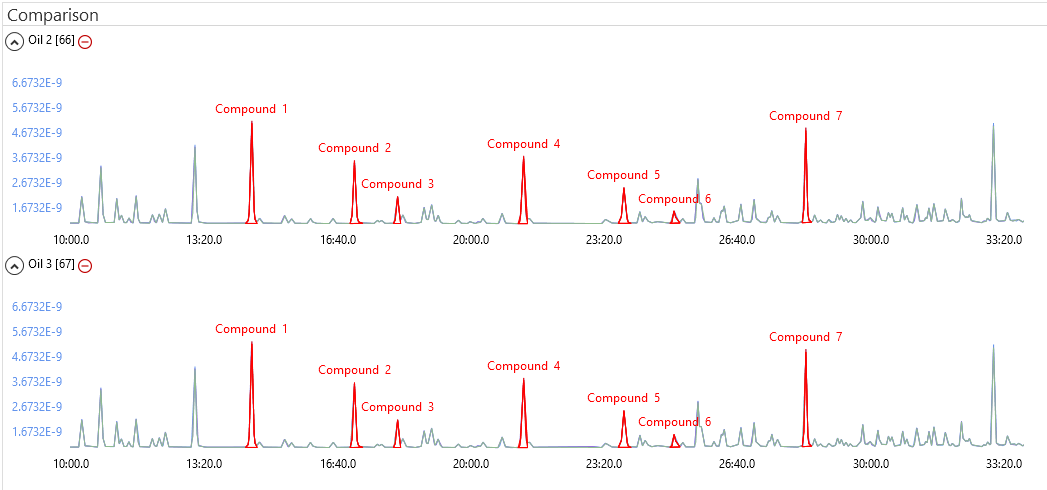
Applying a Peak Map to an injection ensures that the relevant identified compound results are reported consistently across injections. The comparison view makes it straightforward to verify that the correct compounds are identified across injections.
A Peak Map can be adjusted to fit similar chromatograms where peak retention times vary (e.g. offset or stretched) by explicitly assigning compounds to peaks.
A Peak Map allows for peak integration customizations to be applied to all injections associated with the same Peak Map.
You can define one or more Peak Maps (with the same or different compounds) within a batch.
Peak Maps can be imported and exported allowing them to be reused across multiple batches.
Identification
GC batch processing comparison view showing 2 injections sharing the same Peak Map
Varying Retention Times
A Peak Map can also easily be made to fit injections that share the same compounds but where the retention times vary.
A peak can be explicitly identified as a particular compound by dragging the compound onto the peak from the Peak Library or by right-clicking on the peak and selecting the Manually Assign Peak Id option.
Example 1
GC batch processing comparison view showing 2 injections with a retention time offset sharing the same Peak Map displays two injections that largely share the same compounds, however there is a shift in the retention times of the peaks after 23:20. In this example, A Peak Map was generated from the first chromatogram and both injections been associated with this Peak Map. The shift in the retention times was then easily corrected for by explicitly identifying Compounds 4 and 5 on the second chromatogram. The rest of the compounds after Compound 5 were then automatically identified because their retention times were shifted by the same offset (between Compounds 4 and 5).
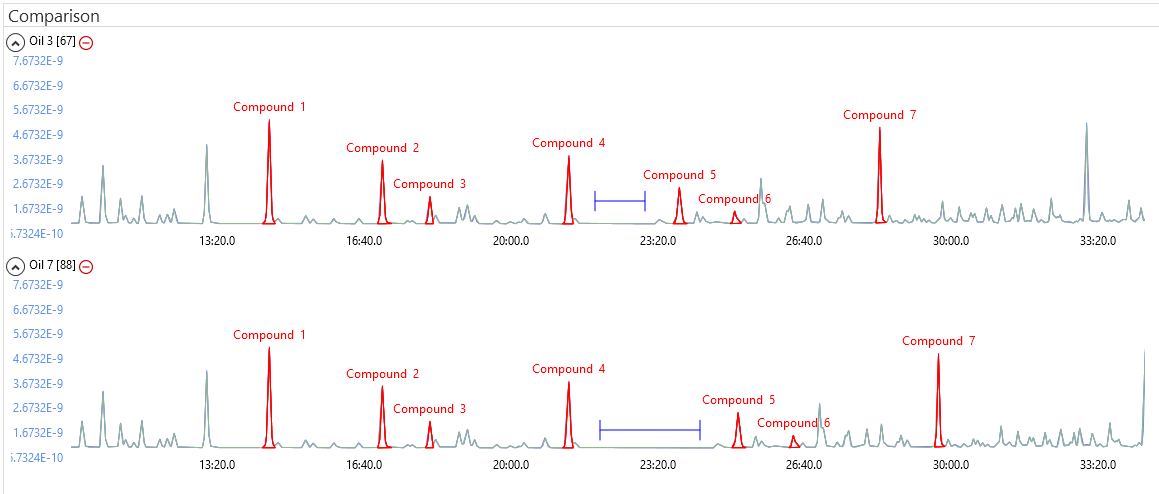
GC batch processing comparison view showing 2 injections with a retention time offset sharing the same Peak Map
Example 2
GC batch processing comparison view showing 2 injections where the retention time has been stretched sharing the same Peak Map displays two injections that largely share the same compounds, however the retention times have all been stretched. The stretching was easily corrected by explicitly identifying Compounds 1 and 7. The rest of the compounds were then automatically identified because lyticOS assumed that the stretching is linear between fixed points.
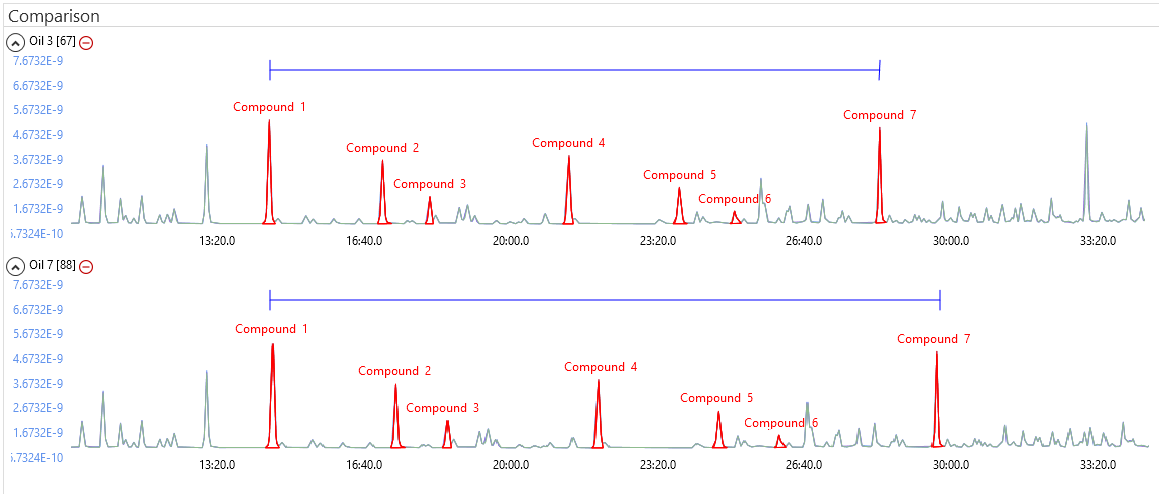
GC batch processing comparison view showing 2 injections where the retention time has been stretched sharing the same Peak Map
Peak Map Success Indicator
For ease, the Map column within a a batch displays a Peak Map Success indicator foreach injection, which outlines how well a Peak Map has been applied. The Peak Map Success indicator displays the success of each peak position relative to other peaks within the Peak Map.
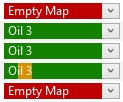
Peak Map Success Indicator showing some injections that are not associated with a Peak Map ("Empty Map") and some that are associated with the "Oil 3" Peak Map. One of the indicators is displaying a potential issue with one of its peaks.
Red indicates that a Peak Map has not been applied.
Orange indicates that an individual peak has not been applied.
Green indicates that an individual peak has been successfully identified.
Yyou could try removing a peak from a specific injection (right click on the peak -> Edit Peaks (Injection)-> Remove Peak) and see the Peak Map indicator update to show you that a peak is missing from the applied Peak Map. Yyou can also try restoring the peak (right click on the peak -> Edit Peaks (Injection) -> Restore Peak).
Peak Boundary Changes
As well as making peak identification easy, a Peak Map also provides a mechanism for synchronizing peak boundaries across multiple injections.
GC comparison view showing two injections shareing the same Peak Map- draggingthe boundary of Compound 2. shows the boundary of Compound 2 being changed at the Peak Map level. The change will then be applied to the second injection because it is shareing the same Peak Map. Varying retention times are taken into consideration by making the change relative to the peak apex.
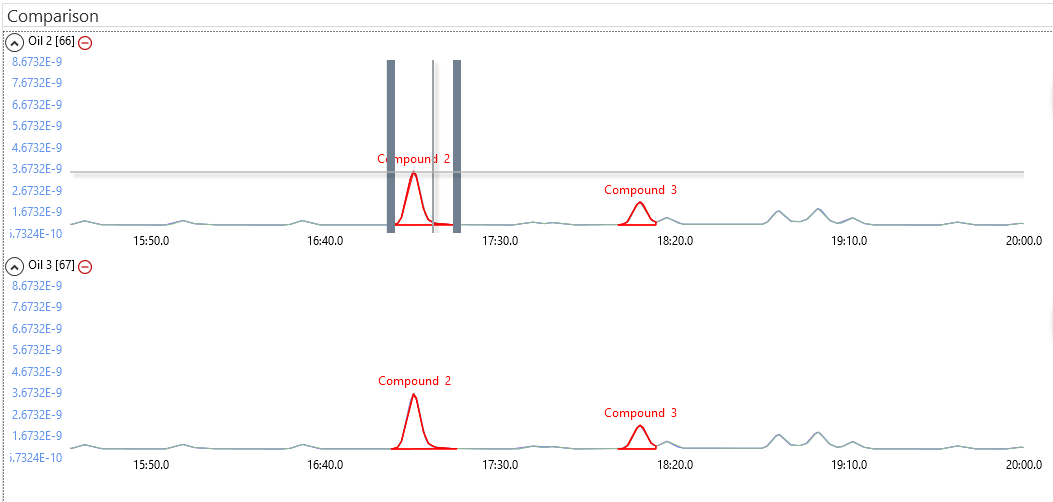
GC comparison view showing two injections shareing the same Peak Map- draggingthe boundary of Compound 2.
GC comparison view showing two injections shareing the same Peak Map- draggingthe boundary of Compound 2. shows that the boundary change has been applied to both injections.
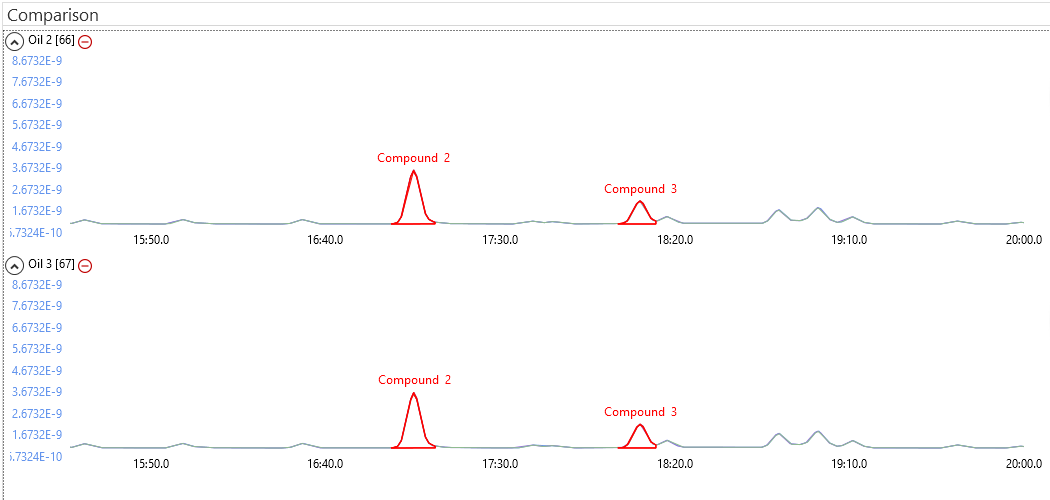
GC comparison view showing two injections shareing the same Peak Map after the boundary of Compound 2 has been changed.
You can also make peak boundary changes at an injection level, as well as define peak detection windows and customise peak baseline points.