Data Processing Parameters
Each batch has its own data processing parameters (changing the parameter in one batch, will not affect another).
Data processing parameters are defined at a global level (used by a connected system to display real time data processing) and copied to newly created batches.
To view/edit the data processing parameters within a batch, select the Processing button within the Ribbon Tab.
The data processing parameters can be changed per species. Select the species of the parameters that you want to edit, within the species drop-down.
You will be presented with three tabs
- The Detection tab contains the settings regarding to peak detection and integration.
- The Processing tab contains the settings regarding to how to turn peak areas into results (ratios, corrections, deconvolutions, etc.)
- The Advanced tab provides further settings regarding to peak data processing (H3+ corrections, etc.)
The data processing parameters are used to detect, integrate and create results for individual samples / injections. To perform data processing corrections and calibration across multiple samples / injections, see the multi-point isotopic calibration section.
Detection & Integration
To allow the data processing to be performed seamlessly without user intervention, lyticOS needs to distinguish between monitoring peaks and sample peaks automatically. lyticOS therefore treats the automatic detection of monitoring peaks differently from sample peaks (i.e. monitoring peaks have a flat top).
These parameters are used as a "first pass" at detecting and integrating the peaks. The detection and integration of individual peaks can be overridden within a batch by explicitly defining individual peak start, end and baseline points.
Baseline
The baseline calculation algorithm for sample peaks and monitoring peaks can be distinct, but it is more common to use the same algorithm for both. The most common and recommended algorithm is "Ratio Offset".
Baseline calculation algorithms include:
-
Peak Horizontal
Pick the lowest point of the peak (either the start or the end) and draw a horizontal line
-
Peak Start / End
Draw a line between the peak start and end.
-
Beam Zero
Take the average at some points (normally at the beginning of the chromatogram) and draw a horizontal line
-
Ratio Offset
Take the average of some points in the vicinity of each individual peak (that are detected as baseline points)
Sample Peaks
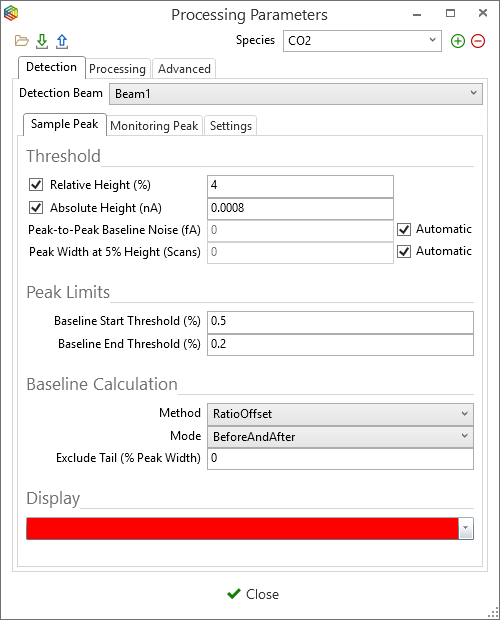
Data Processing Parameters - Sample Peak detection and Integration
Threshold
For sample peaks, the Threshold parameters are used to filter out potentially important peaks from background noise. The Threshold parameters are only used by the automatic detection algorithm and can be ignored by explicitly including a peak on the chromatogram for any particular injection.
- Relative Height - Percentage of the largest detected sample peak that sample peaks must be larger than.
- Absolute Height - The absolute height that sample peaks must be larger than.
Integration
Sample peaks start and end retention times are calculated intelligently based on the baseline slope near each individual peak. Increasing the Baseline Threshold percentage will result in more of the sample peak being excluded.
Monitoring Peaks
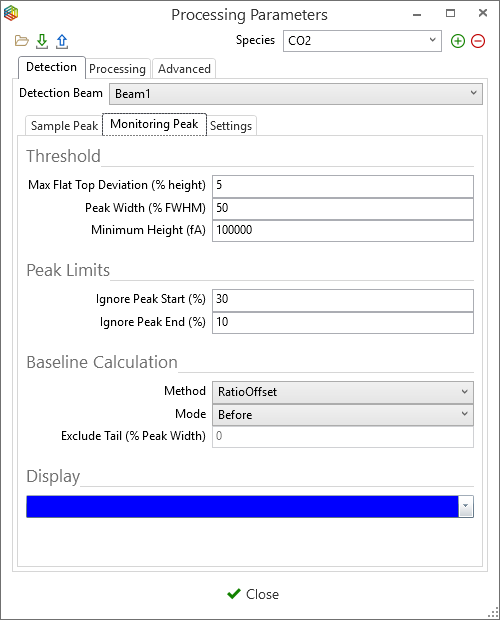
Data Processing Parameters - Monitoring Peak detection and integration
Threshold
The threshold parameters define when a peak is identified as a monitoring peak
Integration
Monitoring peaks start and end retention times are explicitly defined relative to the detected start and end retention times of the peak. The parameters are defined as percentage of the peak width.
Processing
The Processing tab allows you to define which ratios you are interested in calculating. You can also define which corrections you want to apply to turn the ratios into meaningful results for comparison.
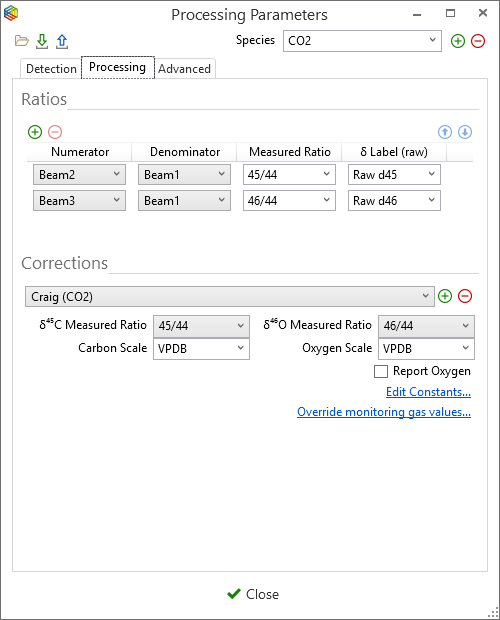
Data Processing Parameters - Ratios and Corrections